Six Weeks on Two DGX Sparks, and Why I Keep Coming Back to LIL
I tested 15 builds on two DGX Sparks. The fastest scored 5/8 on my reasoning test, and one of the most efficient couldn't batch. Here are the numbers, the failures, and why Local Inference Lab's work keeps winning.
Kit Mobley
Islamorada, FL
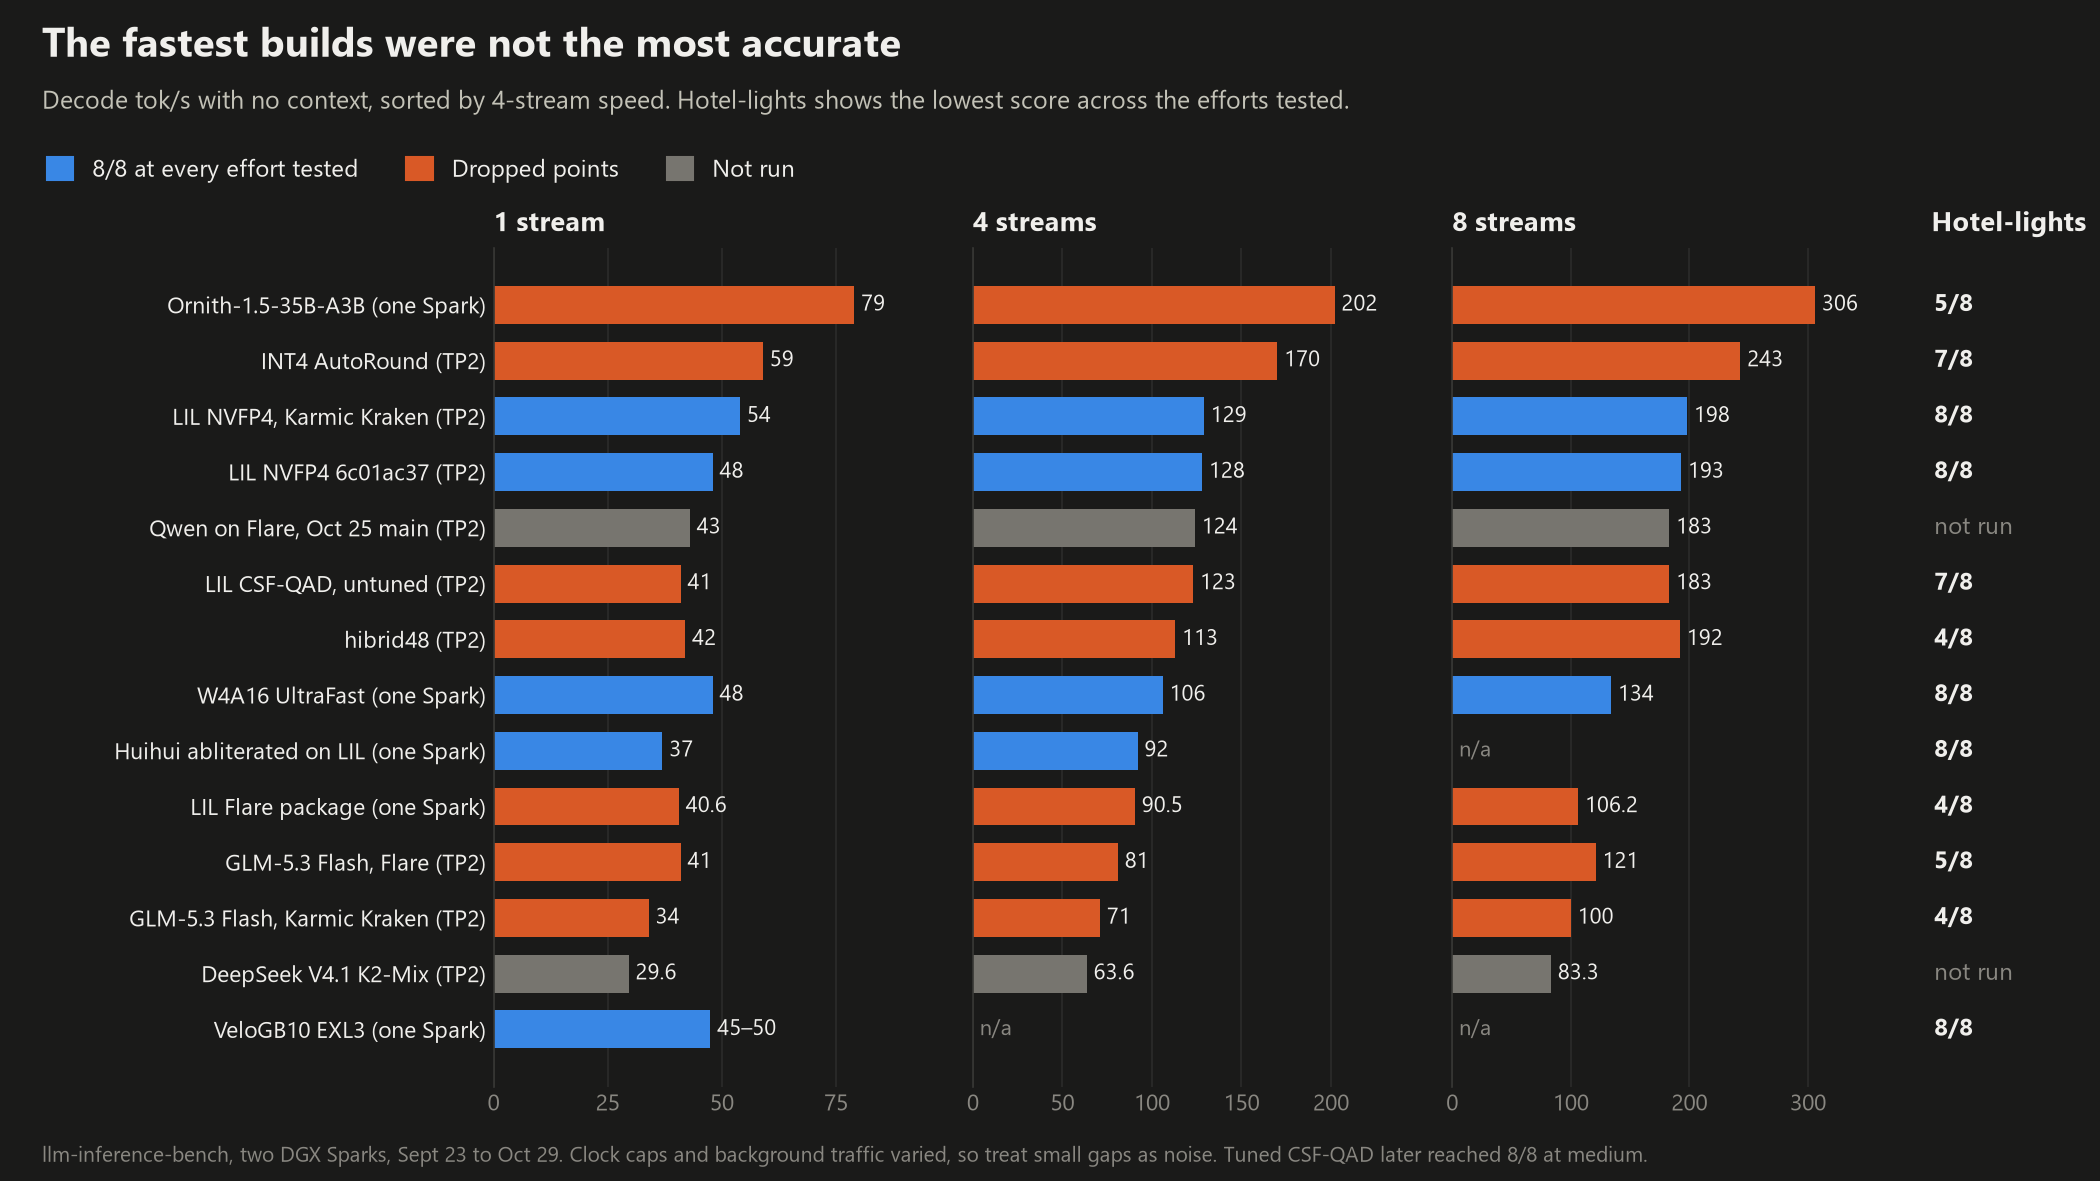
Since September 23, I’ve tried nearly every serving stack I could get running on two NVIDIA DGX Sparks. The fastest build I tested reached 306 tokens per second at eight requests and scored 5 out of 8 on my reasoning test. One of the most efficient, which scored 8/8 with about 16% fewer tokens than the LIL build I was running, couldn’t really handle more than one request at a time.
The ones that kept surviving were built on work from Local Inference Lab (LIL). They were rarely the fastest at anything. They were fast enough, they got the answers right, and the software I run on top of them kept working.
This is the wider record behind my October post on the Qwen recipe I kept, including what’s changed since then.
How I’m measuring
The Sparks are GB10 machines with 121 GB of unified memory each, joined by a direct 200G link. My daily use is agentic coding, mostly Astro sites through OpenCode, with image and video generation on the side.
Four terms come up below:
- TP2 means tensor parallelism: both Sparks run one model together.
- Decode is output speed, in tokens per second. C1, C4 and C8 mean one, four and eight requests at once, added together.
- Hotel Lights is a reasoning check from the benchmark harness, run eight times. An answer only counts if it’s exact.
- KV cache is how much conversation the server can hold in memory. It matters a lot for long agent sessions.
The scoreboard
These runs use llm-inference-bench with no prompt context. Hotel Lights shows the lowest score across the reasoning efforts I tested.
| Build | Layout | C1 / C4 / C8 tok/s | Hotel Lights |
|---|---|---|---|
| Ornith-1.5-35B-A3B | One Spark | 79 / 202 / 306 | 5/8 |
| INT4 AutoRound | TP2 | 59 / 170 / 243 | 7/8 |
| Nemotron 3.5 Super-VL NVFP4 on vLLM, DFlash | TP2 | 57 / 111 / 161 | 4/8 |
| LIL NVFP4 on Karmic Kraken | TP2 | 54 / 129 / 198 | 8/8 |
LIL NVFP4 6c01ac37 |
TP2 | 48 / 128 / 193 | 8/8 |
| Qwen on Flare, Oct 25 main | TP2 | 43 / 124 / 183 | Not run |
| LIL CSF-QAD, untuned | TP2 | 41 / 123 / 183 | 7/8 |
| hibrid48 | TP2 | 42 / 113 / 192 | 4/8 |
| W4A16 AutoRound “UltraFast” | One Spark | 48 / 106 / 134 | 8/8 |
| Huihui abliterated, built on LIL | One Spark | 37 / 92 / n/a | 8/8 |
| LIL Flare package | One Spark | 40.6 / 90.5 / 106.2 | 4/8 |
| GLM-5.3 Flash + MTP + vision on Flare | TP2 | 41 / 81 / 121 | 5/8 |
| GLM-5.3 Flash on Karmic Kraken | TP2 | 34 / 71 / 100 | 4/8 |
| DeepSeek V4.1 Flash K2-Mix | TP2 | 29.6 / 63.6 / 83.3 | Not run |
| VeloGB10 + EXL3 4.05 bpw | One Spark | 45–50 / no real batching | 8/8 |
These runs span six weeks, with different clock caps, and some shared the machines with live traffic. Treat small gaps as noise. The chart at the top of this post shows the same data.
On this harness, several published numbers didn’t reproduce: UltraFast’s 74 / 212 came out at 48 / 106, and hibrid48’s 92 came out at 42 to 46. Velo’s 137 was 56 to 58 on my kernel and driver, which may explain that gap. It went the other way too. INT4’s author quoted about 109, and I hit 116 to 128 on my streaming Astro prompt. That’s a different method from the table, which is my point: the method matters as much as the number.
Medium effort was the real filter
Almost everything passes Hotel Lights at xhigh effort, but xhigh can think for tens of thousands of tokens per answer. I work at medium, and that’s where builds started missing.
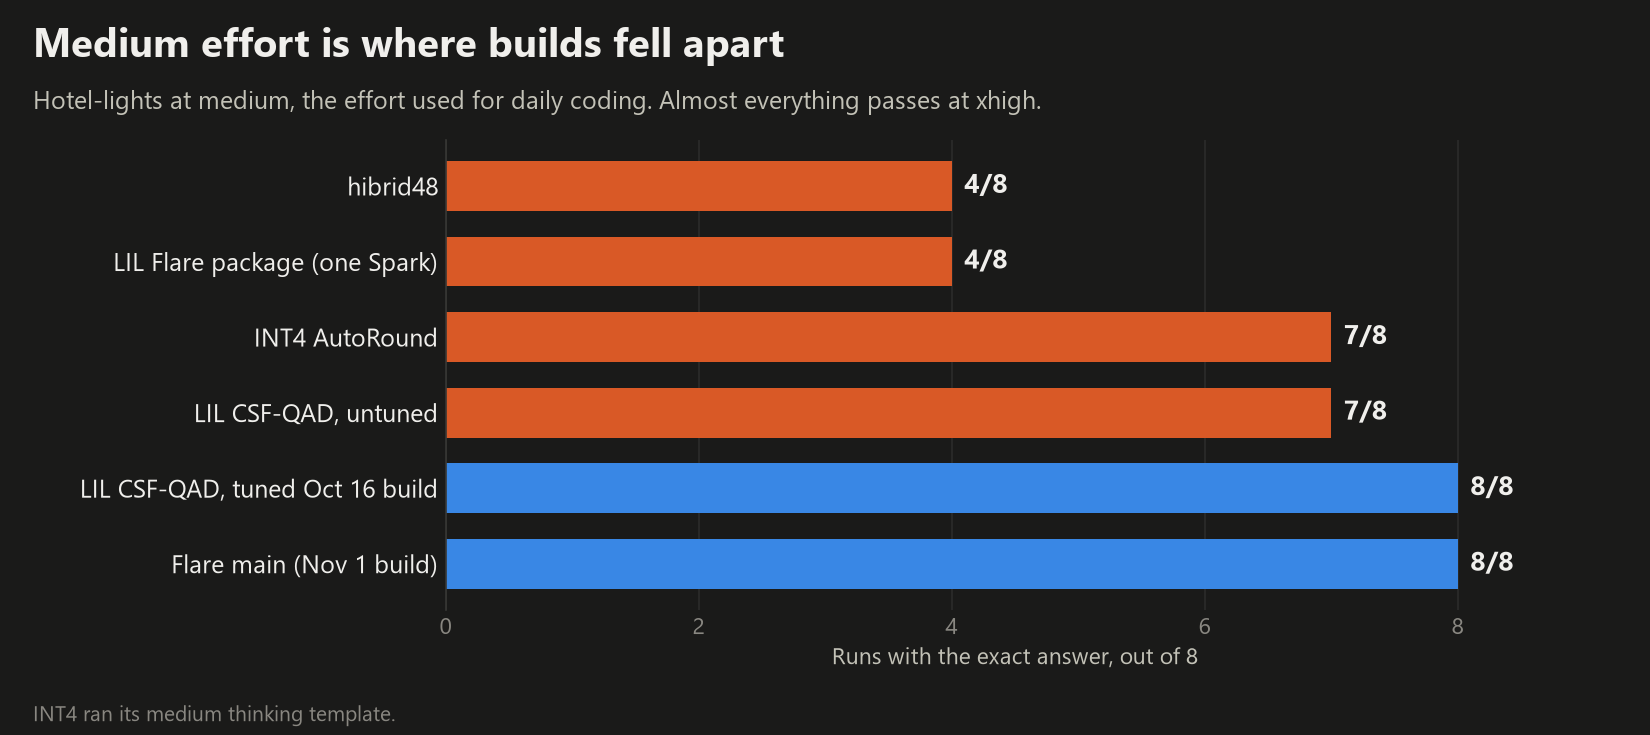
LIL’s own builds weren’t immune. Their first Flare package scored 4/8 at medium on one Spark, and untuned CSF-QAD scored 7/8. The October 16 tuned build, using the settings in my recipe, got to 8/8.
November 1: Flare at current main
On November 1, I rebuilt Flare from NVIDIA/spark-local-inference main at 6fa01a49, with NVIDIA’s FP4 checkpoint, across both Sparks. So this one isn’t a LIL checkpoint, though LIL publishes Flare images and packages and was the first place I ran it.
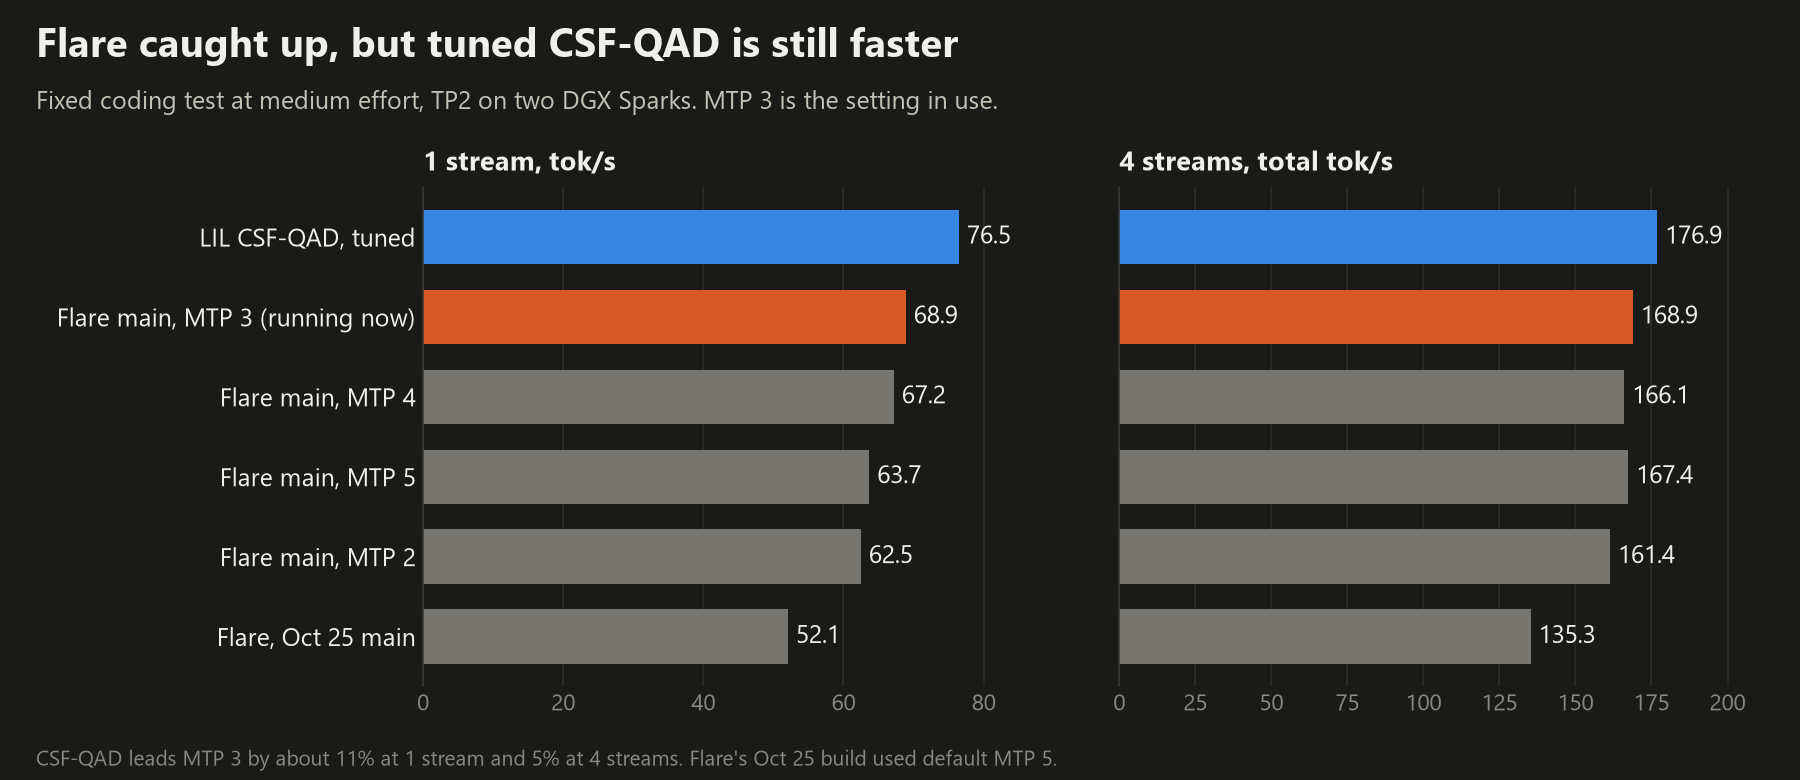
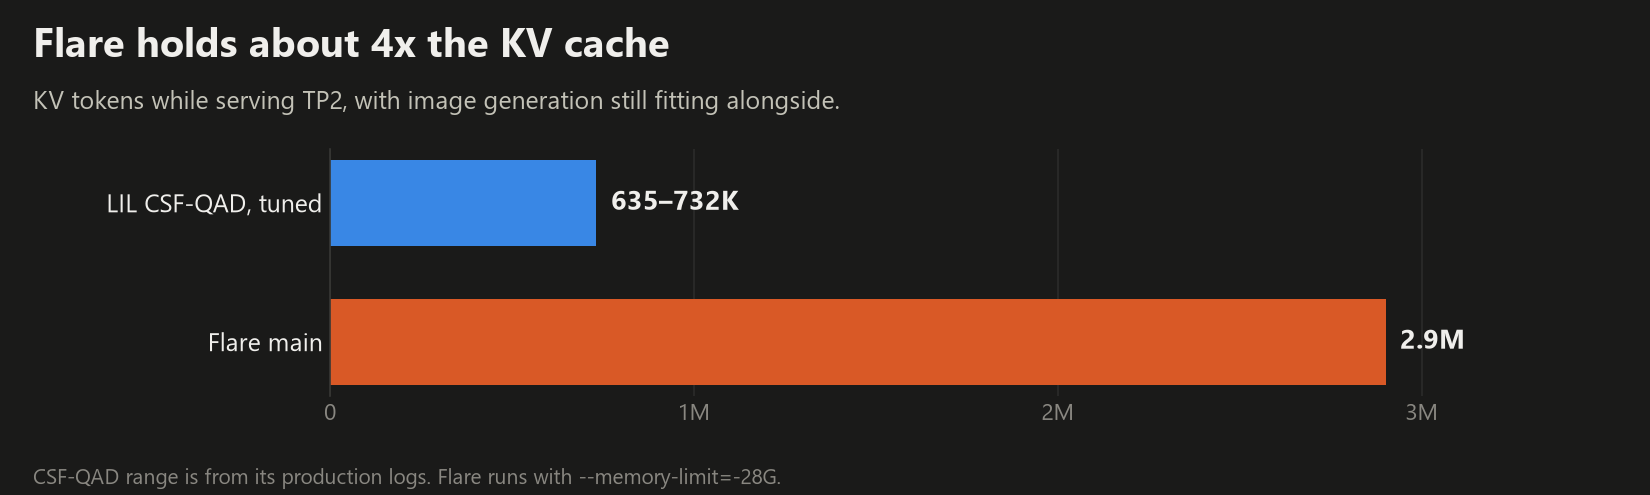
That’s the same fixed coding test as my October post, at medium effort. It’s a large jump from the October 25 Flare build, and tuned CSF-QAD is still about 11% faster at one request and 5% at four. I’d set a goal of 195 at four requests before moving over, and Flare didn’t reach it. I moved anyway, because of the cache:
The other results on Flare:
- Hotel Lights at medium: 8/8, 21.1K tokens on average, 47.1 tok/s per request. CSF-QAD also scored 8/8, at 54.3 tok/s per request.
- Hotel Lights at xhigh: 8/8, 45.5K tokens on average, 36.7 tok/s per request, with image renders and live traffic running alongside. CSF-QAD also scored 8/8, at 47.0K tokens.
- Tools and vision: tools 5/5, vision 8/8.
- Export: 37 minutes with no Xid errors in the kernel logs on either machine.
LIL members looked at these numbers and said they look about right for Qwen TP2, and that MTP 3 is the right setting. I’ve posted the details that might help others on the project’s issues, on the Xid fault, checkpoint transfer speed, kernel tuning memory and two-rail RoCE.
Moving wasn’t a drop-in swap. This Flare recipe accepts only xhigh, medium and low effort, rejects strict: true, defaults to xhigh and serves a single model name. Everything of mine expected something else, so a small proxy now maps the old names, defaults to medium, turns high into xhigh and drops strict. CSF-QAD stays on disk as the rollback.
November 2: what I run now
A day later I moved again, to a Qwen TP2 package a LIL member publishes as JMNI-Labs. It’s built with CSF-QAD for Flare, and its card claims 5.7 million tokens of KV cache. That number assumes nothing else is using the memory, and I run ComfyUI alongside. I got 3.6 million, and about 3.5 million after the driver change below.
It took a day of testing to get numbers I trust, for a reason covered below. These runs all use the harness at 8K context with up to 16 requests. The coding peak column is the median of ten coding prompts at one request. Every row is one run, except production, which got two. The two disk runs moved by 3 to 6%, so treat anything smaller as noise.
| Setup | C1 / C4 / C16 tok/s | Coding peak | KV cache |
|---|---|---|---|
Production on driver 580: disk table, -28GiB, ComfyUI up but idle |
63.2–64.1 / 158.5–158.6 / 295.8–305.1 | 78.0 | 3.63M |
Disk table, -16GiB, first run |
59.3 / 151.4 / 288.8 | 77.6 | 5.13M |
Disk table, -16GiB, second run |
62.6 / 161.0 / 298.4 | 75.5 | 5.36M |
Disk table + resident scales + 4 GiB row cache, -16GiB |
62.1 / 154.7 / 303.7 | 77.2 | 4.27M |
RAM table, -16GiB |
60.2 / 157.1 / 323.7 | 79.4 | 1.43M |
| JMNI-Labs’ card: RAM table, no limit, nothing else running | 67.9 / 161.8 / 331.5 | 78.2 | 5.7M |
Only the -16GiB rows had ComfyUI stopped. Production’s coding peak comes from the second pass only, because an outside request landed during the first.
What I take from this:
- RAM beats disk where it counts for batching. It’s about 8 to 12% faster at 16 requests, and the rest is within noise or close to it. Early on I’d told the package’s author that disk was winning. They said that shouldn’t happen, and they were right.
- RAM costs too much KV for how I use these machines. It left 1.43 million tokens at
-16GiB, and ComfyUI needs another 12 GiB held back on each Spark. So I stayed on disk. - Another LIL member’s tuning tip didn’t move the numbers here. Keeping the embedding scales in RAM (
--embedding-table-resident-scales) with a bigger row cache (--embedding-table-cache-size) cost about a million tokens of KV. It halved disk reads per cache miss, but lookups only improved from 1.66 ms to 1.55 ms. My runs were too short to test the cache size: they filled about 0.4 million of the 10 million rows the default 1 GiB holds. A long-running server might see more. - The memory limit cost KV, not speed. Production at
-28GiBkept pace with the disk runs at-16GiB.
It isn’t a clean win, and these are the open items:
- Hotel Lights at medium fell to 7/8, in three runs out of three, answering 47, 49 and 53 instead of 48. The third run was on the new driver. The November 1 Flare build scored 8/8. I don’t know why yet. At xhigh it scored 8/8, with 37.7K tokens on average at 41.3 tok/s per request, against 45.5K and 36.7 for the November 1 build. That’s about 15 minutes per answer, so I still work at medium.
- Vision is mostly a wash. At medium it scored 8/8, 7/8 and 8/8, and every miss was the same image, where it read a checkout total of $1,284.50 as $1,248.50. The November 1 build’s 8/8 was a single run, so I can’t call this a regression. Tools stayed at 5/5.
- I haven’t reproduced the card’s best coding number, 85.3 tok/s at one request and 209.7 at four. I don’t have its prompt yet, so I can’t say whether the gap is my setup or a different test.
- I haven’t timed TRELLIS next to this setup.
- It’s been in production only since November 2, with plenty of restarts from all this testing, and a driver change on November 3, so I can’t call it stable yet.
It also takes more setup than a normal install. The package is signed with a development key, so you have to explicitly trust that key on each host, and that trust stays. To get the most KV I also built Flare with the package’s host-system-reserve patch. The old Flare build and CSF-QAD both stay on disk for rollback.
November 3: a driver upgrade
On a Flare issue about an Xid fault during DeepSeek exports, other Spark owners reported that NVIDIA’s 615.71.09 driver made the fault go away. I was still on 580.178.04, so I upgraded both Sparks and reran the production checks with the same flags:
| Driver | C1 / C4 tok/s | Coding peak (median / max) |
|---|---|---|
| 580.178.04 | 63.2–64.1 / 158.5 | 78.0 / 82.6 |
| 615.71.09 | 70.1–70.3 / 174.3 | 85.2 / 91.3 |
That’s about 10% faster at one and four requests, from the driver alone, and now slightly ahead of the package card at one request and on the coding peak. I’ve left out 16 requests, because an outside request landed during both passes. There were no Xid errors on either Spark, tools still passed 5/5, and renders still worked next to the model.
Three things to know before you try it:
- It’s ahead of NVIDIA’s supported stack. According to the issue thread, NVIDIA validates only the R580 driver on DGX Spark.
- The obvious install changes more than the driver. On DGX OS,
apt install nvidia-driver-615-openalso pulled in DKMS and a newer kernel. I installed Ubuntu’s no-DKMS driver packages with the prebuilt module for my current kernel, pinned the kernel meta-packages and held them, so a later upgrade can’t boot a kernel that has no 615 module. My comment on the issue has the details. - Check for an old CUDA compatibility library. My Flare service still pointed
LD_LIBRARY_PATHat a CUDA 595 forward-compatibility library from the 580 days, which would have loaded instead of the new driver’s own.
The KV cache changed in a way I don’t understand yet. Right after the reboot, -28GiB gave 4.39 million tokens, but ComfyUI’s Spark then dropped to about 8 GB available with its model loaded, which is too tight for me. Later starts at -30GiB and -32GiB gave only 2.73 and 2.51 million tokens, with about 16 GB to spare. So the size depends on the state of memory when Flare starts, not just the limit. After dropping the page cache on both Sparks, -28GiB gave 3.51 million tokens, with ComfyUI’s Spark bottoming out at 12.4 GB available during six renders. That’s what I run now. Restarting without clearing the cache gives less KV, which is the safe direction.
The pattern
Every time I tried something else, it ended the same way:
- October 6: the randomvariable image was 13 to 16% slower, and Ornith scored 5/8. Back to the LIL checkpoint.
- October 7: Velo scored 8/8 with about 16% fewer tokens, but had no real batching and ignored
json_schema. Back to LIL. - October 17: hibrid48 scored 4/8 at medium. Back to LIL CSF-QAD.
- October 18: NVIDIA’s Nemotron 3.5 Super-VL passed tools 5/5 and Hotel Lights 8/8 at xhigh, so I switched to it. At medium it scored 4/8, with two answers far off (16 and 25 instead of 48). It also ran 32 tok/s per request on that test, against 47 to 54 for the Qwen builds I’ve run since. Back to LIL CSF-QAD the next day.
- October 24: GLM-5.3 on Flare ran at about half the speed and used three times the tokens. I stayed on LIL’s Qwen.
- October 29: DeepSeek V4.1 Flash, in the K2-Mix variant I tested, was about 1.5x slower at one request and 2x at eight. Back to Qwen.
The fast builds lost on exact answers, and the most efficient one lost on batching and API support. The difference that doesn’t show up on a scoreboard is what happens to everything downstream. My scheduled jobs and chat services expect structured output, tool calls and specific model names, and all six of my API compatibility tests passed on LIL’s TP2 stack. Velo passed four.
What cost me the most
“Available” memory can be misleading. One Spark hard-locked during a render with 17 GB reported as available. Most of that was page cache, and the kernel logged an out-of-memory error from the GPU driver. I set vm.min_free_kbytes=4194304 and now run a memory guard next to anything heavy. It didn’t end every freeze, and some I never explained: a later 4.2-hour load test ran over 1,500 requests with none. That protection isn’t free. With the same memory limit it costs about 1.7 million tokens of KV cache, 3.8 million against 5.5 million. I tried running without it, my ComfyUI guard fired as soon as the model loaded, and I put it back.
A Spark can come back from a freeze badly slowed. After a run of freezes, one GPU was stuck at 507 MHz and about 10 W, roughly 40% slower. A full power drain fixed it: power off, unplug the brick from the wall and the box, and wait at least 60 seconds. If speed ever falls off, check nvidia-smi --query-gpu=clocks.sm,power.draw --format=csv first.
The RoCE GID index can move. A reboot moved mine from 3 to 5 and 6, and production wouldn’t start, with NCCL error: remote process exited. My scripts look it up at launch now.
Video and an LLM don’t share well. LTX next to the model hard-locked a Spark even with 40 GB of headroom, so video mode now stops the model first.
Rendering slows both machines. With TP2, every step waits for the slower box. I measured about 70 tok/s dropping to 45 during a render in October. On Flare, I watched a live session fall from about 61 to about 41 while a batch of images rendered. I didn’t test that session with renders stopped, so that last one is my best explanation, not a controlled result.
Check who else is using the server. My benchmarks fell by about 30% one afternoon, and I spent hours on memory settings before I found my own VPS jobs sending live requests through the proxy. That traffic had already led me to a wrong conclusion, that disk beat RAM. Clocks and thermals looked fine the whole time. Now I sample flare_active_requests every 2 seconds during a run and throw out anything that shows a request I didn’t send. Earlier numbers in this post don’t have that check, including the coding test chart above.
Check your downloads. An nc copy over the fast link left a truncated shard that Hugging Face’s tooling then skipped. The filenames are the LFS sha256 hashes, so checking is easy.
A quick probe can mislead you. The same stack gave me 54 tok/s on the harness and 74 to 76 on a streaming code prompt. Both are right. Measure with streaming and usage token counts, because chunk counts undercount with speculative decoding.
What else runs on these machines
These are the other workloads I’ve timed on the Sparks:
- Qwen-Image 2.1 int8 with Turbo8: about 18 seconds per render next to the model on the current setup, after a slower first render. Before that, about 20 seconds at 1024×1024.
- TRELLIS.2 image-to-3D: 210 seconds for one asset with 534K vertices, next to the previous model setup.
- LTX-2.5, with the model stopped: 54 to 57 seconds for a 3-second 768×448 clip, one clip per Spark in parallel.
- NVIDIA Sol-H3 text-to-video with audio: 1.52 clips a minute split across both Sparks, against 0.85 on one.
What I’d do differently
I’d have started with the test that matches how I work. A benchmark table made Ornith look like the obvious choice, and it took Hotel Lights at the effort I use and the API checks my software depends on to show otherwise. Those two checks have ruled out more builds than any speed number.
Credit belongs to Local Inference Lab, the Flare and FlashInfer contributors, and the people whose kits and quantizations I tested. My contribution is the comparison and a record of what actually ran on these two machines. If you’re on a single Spark, my arm64 Karmic Kraken build is public, and the TP2 recipe has the settings for two.
Frequently asked questions
- Which LLM setup would you run on two DGX Sparks?
- Two builds scored 8/8 on Hotel Lights at medium effort. Tuned CSF-QAD from Local Inference Lab is the faster, at 76.5 tok/s for one request and 176.9 tok/s total across four in a fixed coding test. Flare at current main reaches 68.9 and 168.9 with about four times the KV cache. I now run a Flare package from JMNI-Labs instead. On NVIDIA's 615 driver it does 70 tok/s for one request and 174 across four on a different test, with 3.5 million tokens of KV cache next to ComfyUI. It scored 7/8 at medium in three runs, so it gives up a little on that test.
- Can a DGX Spark run ComfyUI next to a large language model?
- For images, yes, with limits. In my latest test, Qwen-Image 2.1 took about 18 seconds per render with the model under load, and every render finished. Available memory on that Spark stayed above 12 GB. Rendering slows the model because both Sparks wait on the busier one. LTX video next to the model hard-locked a Spark, so video mode stops the model first.
- Why does a DGX Spark freeze with memory still available?
- In the case I traced, "available" memory was mostly page cache and the GPU driver's allocation failed instead of waiting for reclaim. The kernel logged an out-of-memory error from the NVIDIA driver with 17 GB reported as available. Not every freeze I hit has been explained.
SHARE THIS POST